

The Economic and Social Survey of Asia and the Pacific 2023 highlighted that 19 countries in the region are facing a high risk of debt distress.[1] While the public debt-to-GDP ratio is the most widely used indicator to gauge the public debt situation of a country due to its simplicity, availability and comparability across countries, the Survey argues that a higher debt level does not necessarily mean a higher risk of debt distress. Several other factors matter, such as the strength of fiscal positions and debt-servicing capacity; the drivers and purpose of increasing debt; the composition (domestic versus external) of debt; the creditor profile; and certain domestic structural, governance and institutional aspects. A better understanding of the public debt profile is required while assessing the debt sustainability of an economy.
However, as illustrated by Seiferling (2020), there are two challenges in analyzing public debt statistics. Firstly, “most of the world’s governments still do not seem to feel sufficient pressure to voluntarily provide comprehensive financial statistics based on well-defined modern methodological frameworks,” and secondly, “high profile financial statistics, which are reported, have become increasingly numerous and complicated, making it difficult for non-experts to know which is most appropriate in the context of their analysis”.
A new public debt dashboard for Asia and the Pacific
To fill in the data gap and provide a comprehensive and country-level picture of public debt in Asian and Pacific economies, ESCAP has recently developed a Public Debt Dashboard for Asia and the Pacific. This Dashboard brings together data from various sources such as the IMF’s Government Finance Statistics and World Economic Outlook databases, World Bank’s International Debt Statistics and Asian Development Bank’s Asian Bonds Online data portal, complemented by ESCAP’s own calculations. This newly released Dashboard groups the debt indicators into four categories:
- General Government Gross Debt
- External Public and Publicly Guaranteed Debt
- Domestic Public Debt
- Debt Sustainability
Public debt profiles are presented at three levels.
- ESCAP regional overview offers pre-defined comparisons across all ESCAP subregions.
- Subregional dynamics allows users to select two or more countries from the same or different ESCAP subregions and compare over a selected time period.
- Country profiles provide public debt data for any selected country from multiple dimensions and over years.
The Dashboard not only addresses the issues of data availability and comparability, but also data complexity. It provides data visualization in the form of interactive charts, allowing users, who are less familiar with public debt data, to navigate in a pre-designed structure.
This ESCAP Dashboard can assist various stakeholders, such as government officials who wish to better understand public debt landscape in their own country and regional peers, researchers working on public debt issues in Asia and the Pacific, and United Nations country teams.
A more holistic look at public debt profiles matters for assessing public debt sustainability
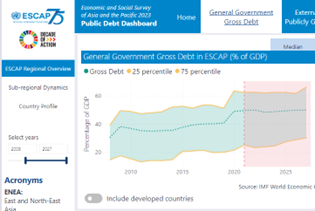
The Survey 2023 shows that government debt levels in developing countries in Asia and the Pacific have been on the rise since 2008 (figure 1). Even before the COVID-19 pandemic, the average general government debt-to-GDP ratio had reached an 11-year high of 40.6 per cent in 2019. Driven by large stimulus packages and declining government revenues, the pandemic pushed up the region’s average government debt level to 49.5 per cent of GDP in 2021.
Figure 1
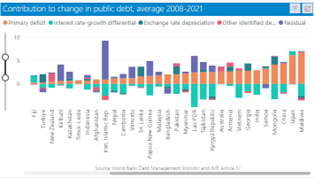
The increase in public debt in the region was primarily driven by primary fiscal deficit (the gap between fiscal revenues and expenditures minus interest payments) in the past decade (figure 2). The interest rate-growth differential was also an important contributing factor, but mostly in limiting the debt surge since the average growth rate in the Asia-Pacific region has been higher than the average interest rate. For a few economies, local currency depreciation also explains a considerable part of rising government indebtedness.
Figure 2
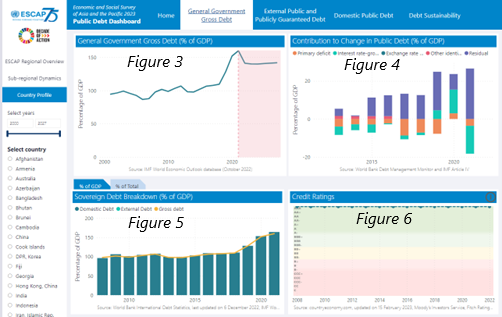
As highlighted in the Survey 2023, understanding the drivers and composition of increasing debt are critical in analyzing a country’s public debt sustainability. For example, despite a high level of general government debt at over 150 per cent of GDP in 2021 (figure 3), Singapore still enjoys the top credit rating of AAA (figure 6). This is mainly because Singapore’s debt is not used to fund its fiscal deficit (figure 4). The Government issues debt, mainly domestic debt (figure 5) to deepen the domestic debt markets, meet the investment needs of the Central Provident Fund and provide individual investors with long-term saving options that offer safe returns.
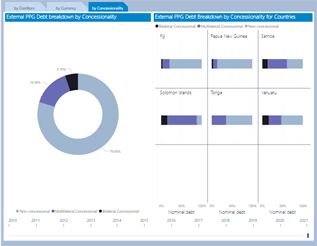
In contrast, many Pacific island countries do not have high government debt level (figure 7), but still face a high distress risk (figure 8). Most rely heavily on external debt, including concessional loans, as their domestic capital markets remain underdeveloped. However, the share of concessional loans from multilateral and bilateral creditors, which are essential to help reduce their fiscal and debt risks, has dropped from 41.5 per cent of external public and publicly guaranteed debt in 2010 to only 20.2 per cent in 2021 (figure 9).
Beyond official creditors, the role of private creditors whose lending tends to be on less concessional terms is increasing in the region’s sovereign creditor landscape. According to the Survey 2023, the share of government bondholders in total external public and publicly guaranteed debt has jumped drastically in 16 countries since 2008. For instance, in 2021, 30 per cent of Mongolia’s external debt was owed to private creditors.
Figure 7
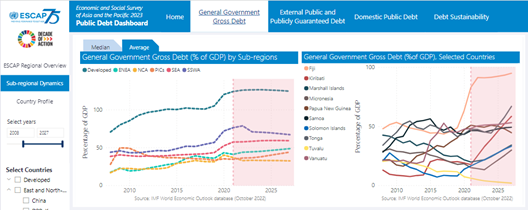
Figure 8
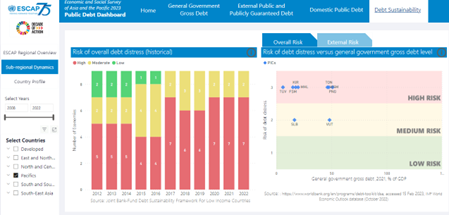
Figure 9
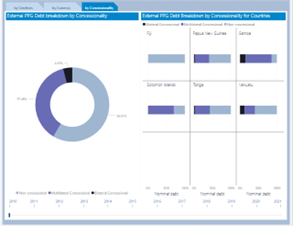
Figure 10
By providing a detailed picture of the public debt situation in Asia and the Pacific, the Dashboard provides several policy implications. For example, increasing public debt in most economies was driven by large fiscal shortfalls, thus highlighting the need to close tax collection gaps and ensure value-for-money public spending.
Also, the Dashboard revealed that low interest rates relative to economic growth rates have helped limit debt surge in the past. As this trend is reversing, Asia-Pacific economies will need to find ways to cope with rising borrowing costs, such as by improving public debt management to increase fiscal transparency and credibility.
More broadly, while the rise of unconventional creditors opens a door to new sources of public financing, governments should also be mindful of potentially higher borrowing costs and shorter loan maturity. When needed, debt resolution negotiations with more diverse creditors could also be more challenging since so far there has been no effective coordination platform to engage unconventional creditors.
Interested in learning more about public debt in the Asia-Pacific region? Please visit the ESCAP Public Debt Dashboard for Asia and the Pacific.
---
[1] Based on the Joint World Bank-IMF Debt Sustainability Framework for Low Income Countries.


